
Digital experience monitoring (DEM) is the practice of measuring how users experience websites, applications, devices, networks, and digital services. It helps spot problems like slow pages, failed transactions, regional latency, or poor SaaS performance.
According to a 2025 study of more than 20 million endpoints by Nexthink, digital friction costs the average organization around 470,000 productivity hours per year. This shows how expensive these small problems can be when added together.
If you don’t want that to happen in your organization, read this guide till the end. This guide explains what digital experience monitoring is, how it works step-by-step, what it measures, its benefits, and the problems it can uncover.
So, let’s get into it.
What Is Digital Experience Monitoring?
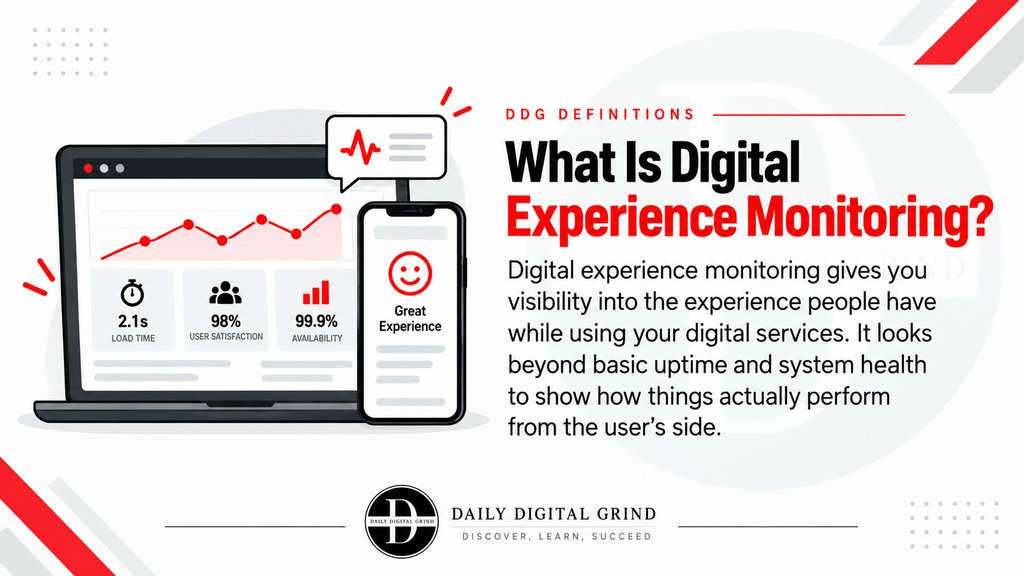
Digital experience monitoring gives you visibility into the experience people have while using your digital services. It looks beyond basic uptime and system health to show how things actually perform from the user’s side.
That includes page speed, application responsiveness, failed transactions, browser or device issues, server errors, network latency, and problems that only affect certain locations or users. This matters because a system can look healthy internally while the experience is still poor.
Your service may be online, your database may be responding, and your application may technically be available, yet users may still have to wait too long for pages to load or fail to complete an important task.
What Does DEM Actually Tell You?
DEM tells you where the user experience starts to break down.
For instance, it can show that users in one region are seeing much slower load times, mobile users are hitting errors that desktop users never see, or employees connecting through a VPN are experiencing higher latency than everyone else.
It can also reveal problems inside important user journeys. e.g., a checkout page that might load normally, but the payment step could fail.
Why Isn’t Traditional Monitoring Enough?
Traditional monitoring can tell you that a server is online, an application is responding, or a database is healthy. What it often can’t tell you is whether the user is actually having a good experience.
That creates a blind spot.
In fact, Riverbed’s 2026 research on financial-services organizations found that IT teams were using an average of 13 observability tools from nine different vendors. Even then, those toolsets created blind spots across applications, networks, and user experience.
Traditional monitoring usually looks from the system outward. DEM adds the user’s point of view.
That means looking at things like real page load times, failed journeys, devices, and browser differences, endpoint issues, and network problems. Many of these problems never show up as a simple server outage.
For websites, performance monitoring is quite useful beyond infrastructure health, as poor website performance can affect the wider experience people have on the site.
How Does Digital Experience Monitoring Work?
Digital experience monitoring works by collecting experience data from different points in the user journey. It then combines those signals to show where performance breaks down and what may be causing it.
The best part is that DEM doesn’t rely on one type of monitoring. You get to see real-user behavior, synthetic tests, endpoint data, network performance, and application signals so teams can see the experience from more than one angle.
Here’s how DEM works, step by step.
Step 1: Collect Real User Experience Data
Start with Real User Monitoring, or RUM. It captures what people experience while using your website or application and shows differences between browsers, devices, locations, connection types, and individual sessions.
To do this, install a RUM-capable tool on your website or application. Tools such as Datadog RUM, New Relic Browser, Dynatrace RUM, or Cloudflare Browser Insights can collect real-user performance data directly from the browser.
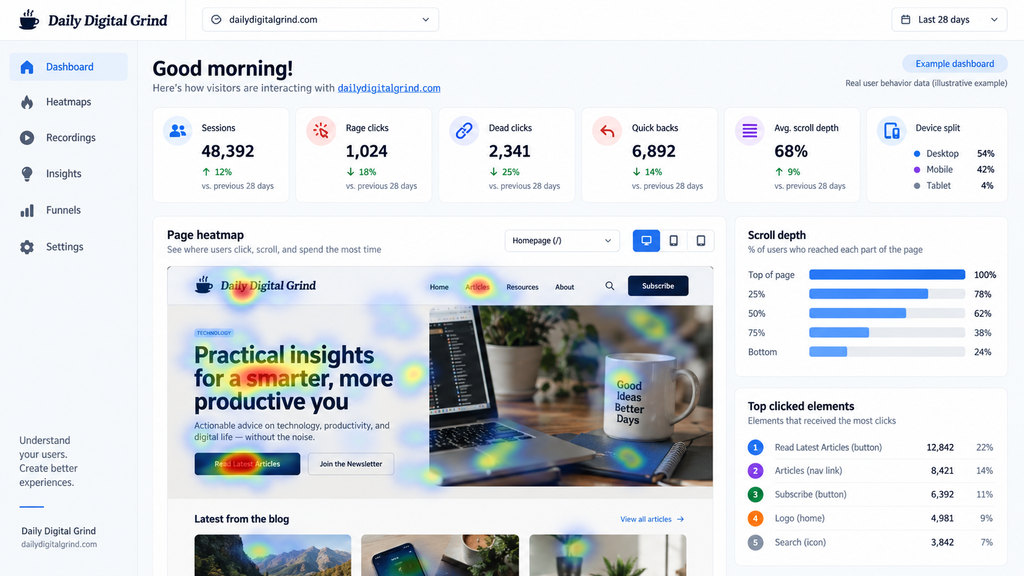
For behavior data, Microsoft Clarity is a practical option because it provides session recordings and heatmaps. I would treat it as a supporting tool, though, because it is not a full DEM platform.
Step 2: Simulate Important User Journeys
Synthetic monitoring lets you test important actions automatically, even when no real user is using the service.
You can do this with Checkly, Datadog Synthetic Monitoring, Catchpoint, or UptimeRobot. For basic uptime, UptimeRobot is easy to understand. If you want to test actual user journeys like login, checkout, or multi-step workflows, Checkly is more useful.
Set up tests for the parts of the site or application that matter most, such as login, checkout, form submissions, APIs, or key pages.
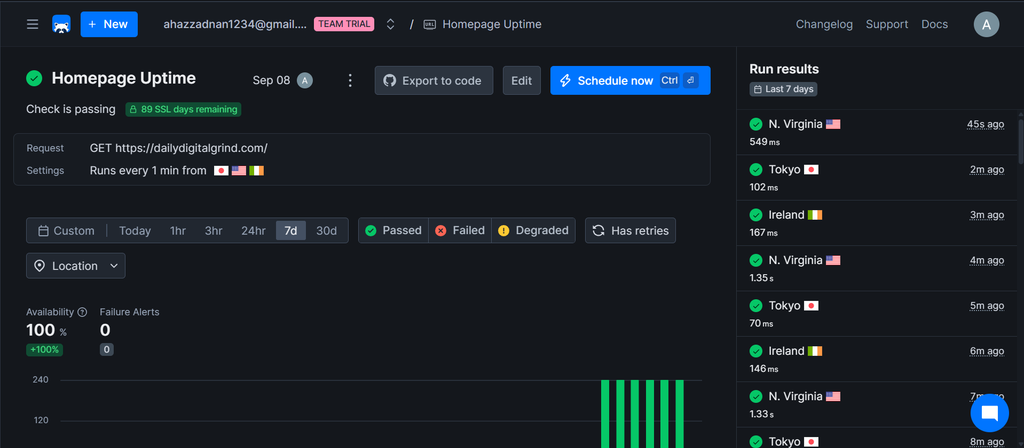
As you can see, I ran the same test on Daily Digital Grind using Checkly. In this case, the check passed from all tested locations, with 100% availability and no failure alerts.
Your results may look different.
Make sure to run these tests from multiple locations whenever possible, then keep monitoring them to confirm the issue stays resolved.
A login flow that works in London but repeatedly slows down in Singapore gives you a very different problem to investigate than a global outage.
Step 3: Monitor Devices and Endpoints
For employee-facing environments, the monitoring focus shifts from browser behavior to the device, network, and SaaS experience.
Endpoint monitoring becomes important when the user experience depends on employee laptops, VPNs, the local Wi-Fi access point, or SaaS applications.
Nexthink, ControlUp, Riverbed Aternity, and Microsoft Intune provide visibility into endpoint health and employee experience. You can use any of these tools to monitor workforce laptops, VPNs, and your Wi-Fi.
If the main problem is a remote workforce, Nexthink is especially relevant because its direct focus is on digital employee experience.
This way, you can separate an application problem from a device problem. Salesforce might be healthy, for example, while one employee’s laptop or VPN connection is causing the poor experience.
Step 4: Track User Journeys and Sessions
A page loading successfully does not mean the user completed what they came to do. Session replay and journey tools simply show where users struggle after the page appears.
For websites, use Microsoft Clarity, Hotjar, FullStory, or Contentsquare to figure out things like rage clicks, dead clicks, repeated interactions, form abandonment, and unusual navigation patterns.
Start with your highest-value pages.
If users repeatedly click a button that does nothing, abandon the same form field, or stop at the same checkout step, you have a much clearer direction for investigation.
Step 5: Check the Network and Internet Path
Sometimes everything inside the application is healthy, but the path between the user and the service is not. That makes visibility into the underlying network infrastructure especially useful when application monitoring shows nothing unusual.
Tools such as Catchpoint, ThousandEyes, PingPlotter, and Cloudflare’s network analytics tools can help identify latency, DNS problems, CDN issues, packet loss, routing problems, and regional slowdowns.
Use any of these, preferably Catchpoint or ThousandEyes, to run tests from multiple locations and compare them.
If users in one country are slow while everyone else is fine, that immediately narrows the investigation. Simply look toward routing, CDN, ISP, routers and switches, or regional infrastructure.
Step 6: Correlate the Experience with the Root Cause
In this final step, you take the signals from real users, synthetic tests, sessions, endpoints, networks, and application monitoring and compare them.
For instance:
Imagine an ecommerce company starts getting complaints that checkout is “randomly slow,” but only from some customers.
When you go and check the dashboard, it looks healthy. Servers are up, CPU usage is normal, and there are no obvious backend errors. With DEM, the team can start eliminating the obvious issues through testing and narrow down the issue to:
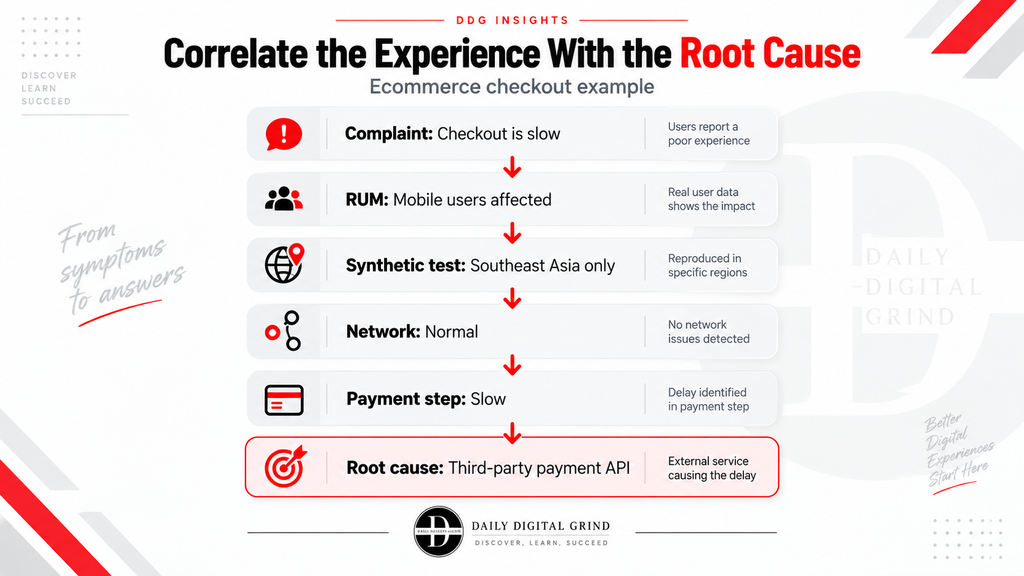
That is the value of digital experience monitoring. It reduces a broad user complaint into a specific, testable technical cause.
Which Metrics Tell You If the User Completed the Task?
The most useful DEM metrics are the ones that show if users can access a service, how well it performs, and if they can complete the task they came to do. The table below shows all these metrics and what a bad result can point toward.
| Metric | What It Tells You | What a Bad Result Can Point To |
|---|---|---|
| Availability | Whether the site, app, or service is reachable | Outages, failed services, DNS issues |
| Page / Load Time | How quickly content becomes usable | Slow frontend, heavy assets, server delay |
| Latency | How long data takes to travel between user and service | Network congestion, routing, distant servers |
| Error Rate | How often requests or actions fail | Application bugs, broken APIs, failed scripts |
| Transaction Success Rate | Whether users can complete key actions | Checkout, login, form, or payment failures |
| Core Web Vitals | How real users experience page loading and interaction | Poor loading speed, responsiveness, layout shifts |
| Session Abandonment | Where users leave before finishing a journey | Friction, slow steps, confusing UX, errors |
| Crash Rate | How often an app or session stops unexpectedly | Software instability, device or application issues |
| Packet Loss | Whether data is being lost across the network | Weak connections, routing, ISP, or network problems |
| Endpoint Performance | How well the user’s device is performing | High CPU, low memory, poor Wi-Fi, VPN issues |
You do not need to treat every metric as equally important. A retailer, for example, should care much more about checkout success rate and checkout latency than a random spike in CPU usage if customers are still completing purchases normally.
What Does Digital Experience Monitoring Look Like in Practice?
DEM becomes easier to understand when you look at the kinds of problems it helps uncover in real environments.
An ecommerce store might see normal server uptime but a sudden drop in completed purchases. Real-user data could show that mobile users are taking much longer to reach the payment step, while session recordings reveal repeated retries.
Similarly, a SaaS company may have an application that stays online all day, yet one feature becomes noticeably slower during peak hours. DEM can show that the issue is isolated to a specific workflow instead of the entire platform.
Remote employees create another common example. Staff may complain that Microsoft 365 or Salesforce feels slow, while the SaaS provider reports no outage. Endpoint and network data can reveal that the real issue is poor Wi-Fi, VPN latency, or a local ISP route.
Lastly, there’s an example in financial services, where even a short delay matters. A login page may load normally, but MFA verification or a payment request may intermittently fail. DEM can track the full journey and show exactly where users start hitting errors.
So, the takeaway from these examples is that a service can appear healthy, even though part of the user experience is already failing.
What Problems Can Digital Experience Monitoring Find?
Instead of only telling you that “something is slow,” it can show who is affected, where the issue happens, and which part of the experience is breaking. Common problems that DEM can help find include:
1. Slow Websites or Applications
A site can stay online and still feel painfully slow to users. The delay might come from the frontend, a third-party script, an API, the network, or the user’s device.
To find the cause, start by comparing real-user load times across desktop and mobile. Then check the slowest pages in a RUM tool or PageSpeed Insights and look for the biggest delay.
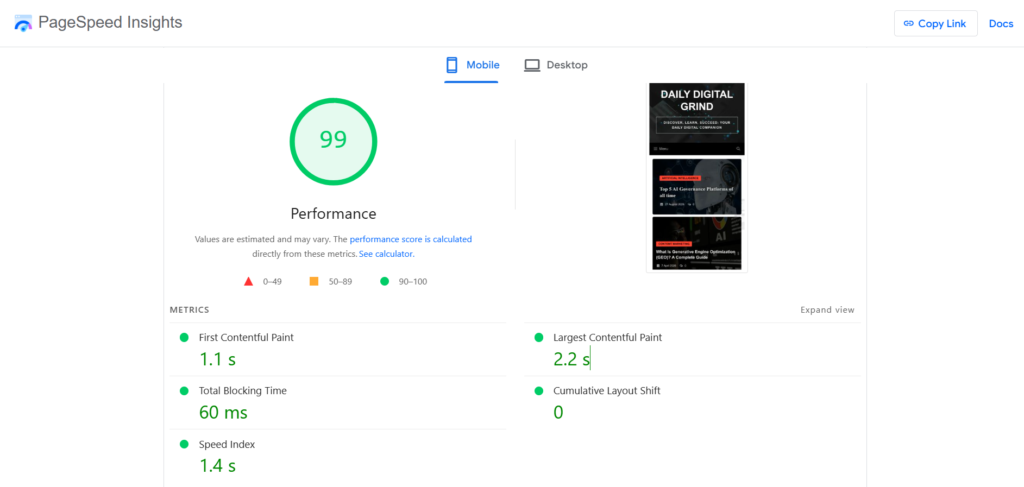
If the slowdown only affects one page, investigate that page first. However, if it affects the whole site, check hosting, CDN performance, scripts, and network latency.
2. Problems That Only Affect Certain Regions
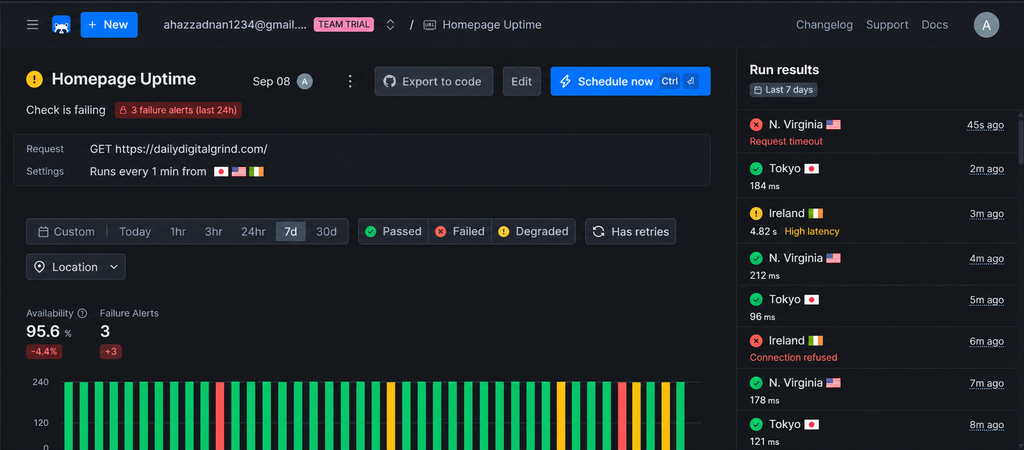
Sometimes users in one country have a bad experience while everyone else sees normal performance. This can happen because of CDN issues, DNS delays, routing problems, or a weak network path.
To be completely sure, run synthetic tests from several locations using a tool like Checkly, Catchpoint, or UptimeRobot.
Compare the response times.
If one region is much slower, check your CDN, DNS provider, and hosting location before changing the application itself.
The image below shows an example of alerts you might see.
3. Browser or Device-Specific Errors
A website might work perfectly in Chrome on desktop yet break on Safari, Android, or an older device. These problems are easy to miss if your team only tests from one setup.
Your team needs to filter your RUM data by browser and device. If one browser has a much higher error rate, reproduce the issue on that browser and check the browser console for JavaScript errors.
On the other hand, if mobile users are affected more, test the page on a real phone before changing anything sitewide.
4. Failed Logins, Forms, or Checkout Steps
The webpage can load normally while an important action still fails. For instance, a login button might stop responding, a form might fail after submission, or a payment request might time out before the transaction completes.
To solve this problem, create a synthetic test that repeats the exact user journey.
Open the login page → Enter test credentials → Submit → Confirm the dashboard loads
If the test fails at the same step repeatedly, investigate that step instead of the whole application. For websites, Microsoft Clarity is the best tool to see repeated clicks or abandoned forms.
5. VPN and Remote-Work Problems
Remote employees often blame the application when the real problem is the VPN, Wi-Fi, device, or ISP. The application itself may be performing normally.
The best way to be sure is by comparing the affected employee with someone who is not experiencing the problem.
Check for:
- Wi-Fi strength
- VPN latency
- CPU and memory usage
- Packet loss
- Performance outside the VPN or Proxy
If the application becomes fast after disconnecting from the VPN, you have already narrowed the problem down significantly.
6. Third-Party API or SaaS Slowdowns
Modern applications depend heavily on outside services. A payment gateway, authentication provider, CRM, analytics script, or API can slow down even when your own infrastructure is healthy.
To find the root cause, check the timing of external requests.
You might find that your main application responds quickly, but one third-party request suddenly takes several seconds.
Check that service directly and check its status page first.
This prevents your team from wasting time tuning servers that were never the problem.
7. Problems Users Notice Before Monitoring Does
Some issues start as small experience problems before they become full outages. Users might see slower pages, intermittent failures, or repeated retries while basic uptime checks still show green.
This is why it’s best to set alerts around user-impact metrics.
For example, trigger an alert when:
- Checkout success drops
- Login time increases
- Error rate spikes
- Page load time crosses your normal baseline
That gives you a chance to react before the issue turns into a much larger incident.
What Are the Benefits of Digital Experience Monitoring?
The biggest benefit of DEM is that it helps teams find the real problem faster. Instead of jumping between server logs, user complaints, browser issues, VPN data, and application dashboards, DEM gives you a clearer view of where the experience starts to break.
That can reduce troubleshooting time significantly because you are working from the user impact first, then tracing it back to the technical cause.
DEM also helps reduce blind spots. A service can stay online while only one region, browser, device type, or user journey is having trouble. Without experience data, those problems can stay hidden for hours.
There is also a direct business benefit.
If checkout slows down, logins fail, or employees struggle with SaaS tools, the impact can show up as lost conversions, lower productivity, more support tickets, and frustrated users.
For customer-facing sites, that means protecting revenue and retention.
For internal systems, it means helping employees get through their work without constantly fighting slow apps, unstable VPNs, or device issues.
When Does a Business Need Digital Experience Monitoring?
A business usually needs DEM when basic monitoring can no longer explain the problems users are reporting.
That often happens as the digital environment gets more complex. That is especially common when cloud applications and infrastructure sit alongside third-party APIs, CDNs, identity providers, and employee devices.
Here’s a quick way to know if DEM is worth using:
| What You’re Seeing | Why DEM Can Help |
|---|---|
| Users complain while dashboards look healthy | Shows the experience from the user’s side |
| Only one region has problems | Helps isolate CDN, routing, DNS, or ISP issues |
| Mobile users perform worse than desktop users | Lets you compare devices, browsers, and sessions |
| Remote employees report inconsistent SaaS performance | Helps separate app, VPN, network, and endpoint issues |
| Checkout, login, or forms fail intermittently | Tracks the full journey instead of basic uptime |
| Several third-party services power one workflow | Helps identify which dependency is causing the slowdown |
Quick Advice: If users are having problems that your current monitoring cannot explain, DEM is probably worth looking at.
What Are the Challenges of Digital Experience Monitoring?
DEM can give you much better visibility into user experience, but it also creates a few problems of its own. The biggest ones are usually cost, alert noise, data overload, privacy, and tool sprawl.
1. Alert Fatigue
More monitoring can easily turn into more alerts.
Grafana’s 2025 observability survey found that alert fatigue was the number-one obstacle to faster incident response, and 33% of respondents identified it as their biggest problem during incidents.
A better setup could be to set up alerts based on user impact.
For example, instead of alerting because CPU usage briefly hits 80%, trigger an alert if checkout success drops, login time spikes, or a critical user journey slows beyond your normal baseline.
2. Too Much Data
DEM can produce a huge amount of telemetry from real users, synthetic checks, endpoints, Saas applications, and networks.
That data is only useful if someone can act on it.
So, the best way is to start small. Choose a few important journeys such as login, checkout, or form submission and collect the signals needed to understand those first. Add more monitoring only when it answers a clear question.
3. Cost Can Grow Quickly
DEM and observability platforms can become expensive as you add users, sessions, endpoints, data retention, and monitoring locations.
In fact, ManageEngine’s 2025 study of 1,240 IT professionals found that 57% named tool cost as their biggest observability adoption barrier. The same research found that many organizations were frustrated by paying for bundled features they did not actually need.
So before choosing a platform, define what you need to monitor.
A small website probably does not need the same stack as a multinational company monitoring thousands of employees and applications.
4. Privacy Can Become a Serious Concern
Some DEM techniques collect much more user-level data than basic uptime monitoring.
Session replay is the clearest example.
Some of these tools can capture highly detailed user interactions and may create privacy problems if sensitive information is collected or sent to third parties without proper controls or user consent.
If you use session replay, configure masking for sensitive fields, avoid recording passwords or payment information, review your consent setup, and understand what data the vendor stores.
Summing Up
Let’s end on some simple advice: Start with the user problem, not the dashboard.
Pick one important journey, such as login, checkout, or a SaaS workflow, then monitor the experience around it. Look at real-user data, synthetic tests, device performance, and network signals only where they help explain that journey.
You do not need to monitor everything at once. Build visibility around the areas that matter most, then expand as new problems appear.
For more expert insights, visit our Digital Marketing Page, and get ahead of the curve. If you have valuable tips or experiences to contribute, Write for Us and inspire professionals working to grow smarter.
FAQs
Why is DEM Important For Businesses?
Digital experiences drive customer satisfaction, retention, and revenue. DEM ensures businesses stay ahead by resolving issues quickly, reducing downtime, and optimizing application performance across all user touchpoints.
Which Industries Benefit the Most from DEM?
Industries like e-commerce, finance, SaaS and remote workforce management benefit most, where performance and user experience directly affect customer trust and business outcomes.
What is the Difference Between DEM and APM?
APM focuses on how applications and servers perform in the backend, like response times and errors. DEM goes a step further by measuring what real users actually experience such as page load speed, usability, crashes, and failed actions across websites, apps, and devices.